Showing posts with label network. Show all posts

October 23, 2017

Turn the lights on in your automated applications deployment - part 2

In the previous post we described the benefit of using Application Automation in conjunction with Network Analytics in the Data Centre, a Public Cloud or both. We described two solutions from Cisco that offer great value individually, and we also explained how they can multiply their power when used together in an integrated way.
This post describes a lab activity that we implemented to demonstrate the integration of Cisco Tetration (network analytics) with Cisco CloudCenter (application deployment and cloud brokerage), creating a solution that combines deep insight into the application architecture and into the network flows.
The Application Profile managed by CloudCenter is the blueprint that defines the automated deployment of a software application in the cloud (public and private). We add information in the Application Profile to automate the configuration of the Tetration Analytics components during the deployment of the application.

Deploy a new (or update an existing) Application Profile with Tetration support enabled

Intent of the lab:
To modify an existing Application Profile or model a new one so that Tetration is automatically configured to collect telemetry, leveraging also the automated installation of sensors.
Execution:
A Tetration Injector service is added to the application tiers to create a scope, define dedicated sensor profiles and intents, and automatically generate an application workspace to render the Application Dependency Mapping for each deployed application.
Step 1 – Edit an existing Application Profile
Cisco CloudCenter editor and the Tetration Injector service


Step 2 – Drag the Tetration Injector service into the Topology Modeler 


Cisco CloudCenter editor

Step 3 – Automate the deployment of the app: select a Tetration sensor type to be added
Tetration sensors can be of two types: Deep Visibility and Deep Visibility with Policy Enforcement. The Tetration Injector service allows you to select the type you want to deploy for this application. The deployment name will be reflected in the Tetration scope and application name.

Defining the Tetration sensor to be deployed

Two types of Tetration sensors

In addition to deploying the sensors, the Tetration injector configures the target Tetration cluster and logs all configuration actions leveraging the CloudCenter centralized logging capabilities.
The activity is executed by the CCO (CloudCenter Orchestrator):
CloudCenter Orchestrator

Step 4 – New resources created on the Tetration cluster
After the user has deployed the application from the CloudCenter self-service catalog, you can go to the Tetration user interface and verify that everything has been created to identify the packet flow that will come from the new application:
Tetration configuration

In addition, the software sensors (also called Agents) are recognized by the Tetration cluster:

Tetration agents

Tetration agents settings


Tetration Analytics – Application Dependency Mapping

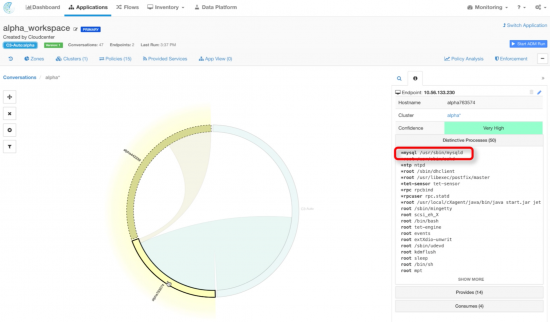
An application workspace has been created automatically for the deployed application, through the Tetration API: it shows the communication among all the endpoints and the processes in the operating system that generate and receive the network flows.
The following interactive maps are generated as soon as the network packets, captured by the sensors when the application is used, are processed in the Tetration cluster.
The Cisco Tetration Analytics machine learning algorithms grouped the applications based on distinctive processes and flows.
The figure below shows how the distinctive process view looks like for the web tier:
Tetration Application Dependency Mapping


The distinctive process view for the database tier: 

Tetration Application Dependency Mapping


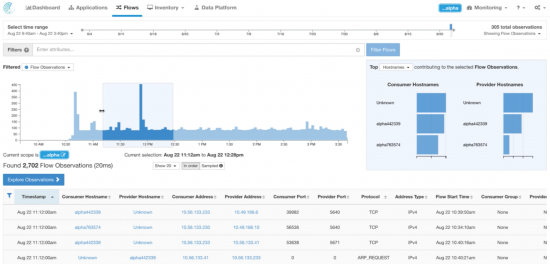
Flow search on the deployed application:  


Detail of a specific flow from the Web tier to the DB tier: 

 Tetration deep dive on network flow


Terminate the application: De-provisioning
When you de-provision the software application as part of the lifecycle managed by CloudCenter (with one click), the following cleanup actions will be managed by the orchestrator automatically:
  • Turn off and delete VMs in the cloud, including the software sensors
  • Delete the application information in Tetration
  • Clear all configuration items and scopes

Conclusion

The combined use of automation (deploying both the applications and the sensors and configuring the context in the analytics platform) as well as the telemetry data that are processed by Tetration help in building a security model based on zero-trust policies.
The following use cases enable a powerful solution thanks to the integrated deployment:
  • Get communication visibility across different application components
  • Implement consistent network segmentation
  • Migrate applications across data center infrastructure
  • Unify systems after mergers and acquisitions
  • Move applications to cloud-based services
Automation limits the manual tasks of configuring, collecting data, analyzing and investigating. It makes security more pervasive, predictive and even improves your reaction capability if a problem is detected.
Both platforms are constantly evolving and the RESTful API approach enables extreme customization in order to accommodate your business needs and implement features as they get released.
The upcoming Cisco Tetration Analytics release – 2.1.1 – will bring new data ingestion modes like ERSPAN, Netflow and neighborhood graphs to validate and assure policy intent on software sensors.
You can learn more from the sources linked in this post, but feel free to add your comments here or contact us to get a direct support if you want to evaluate how this solution applies to your business and technical requirements.

Credits

This post is co-authored with a colleague of mine, Riccardo Tortorici.
He is the real geek and he created the excellent lab for the integration that we describe here, I just took notes from his work.

References


October 20, 2017

Turn the lights on in your automated applications deployment - part 1

A very common goal for software designers and security administrators is to get to a Secure Zero-Trust model in an Application-Centric world.
They absolutely need to avoid malicious or accidental outages, data leaks and performance degradation. However this can be very difficult to achieve sometimes, due to the complexity of distributed architectures and the coexistence of many different software applications in the modern shared IT environment.
Two very important steps in the right direction can be Visibility and Automation. In this blog, we will see how the combination of two Cisco software solutions can contribute towards achieving this goal.
This is the description of a lab activity, that we implemented to show the advantage from the integration of Cisco Tetration Analytics (providing network analytics) with Cisco CloudCenter (application deployment and cloud brokerage), creating a really powerful solution that combines deep insight into the application architecture and into the network flows.

Telemetry from the Data Center


Tetration provides telemetry data for your applications

Cisco Tetration Analytics captures telemetry from every packet and every flow, delivers pervasive real-time and historical visibility across your data center, providing a deep understanding of application dependencies and interactions. You can learn more here: http://cs.co/9003BvtPB.
Main use cases for Tetration are:
  • Pervasive Visibility
  • Security
  • Forensics/Troubleshooting, Single Source of Truth
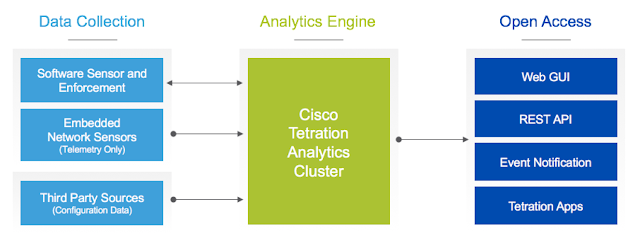
The architecture of Tetration Analytics is made of a big data analytics cluster and two types of sensors: hardware and software based. Sensors can be either in the switches (hw) or in the servers (sw).
Data is collected, stored and processed through a high performance customized Hadoop cluster, which represents the very inner core of the architecture. The software sensors will collect the metadata information from each packet’s header as they leave or enter the hosts. In addition, they will also collect process information, such as the user ID associated with the process and OS characteristics.

Tetration high level architecture


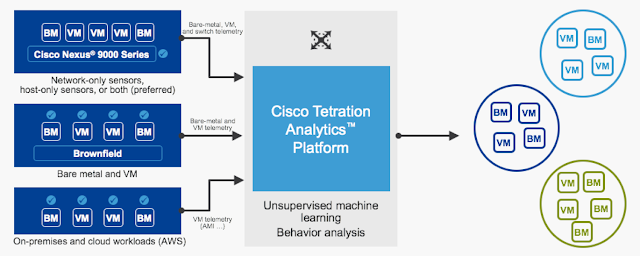
Tetration can be deployed today in the Data Center or in the cloud (AWS). The choice of the best placement depends on whether you have more deployments on cloud or on premises.
Thanks to the knowledge obtained from the data, you can create zero-trust policies based on white lists and enforce them across every physical and virtual environment. By observing the communication among all the endpoints, you can define exactly who is allowed to contact who (white list, where everything else is denied by default). This applies to both Virtual Machines and Physical Servers (bare metal), including your applications running in the public cloud.
As an example, one of your database servers will be only accessed by the application servers running the business logic for that specific application, by the monitoring and backup tools and no one else. These policies can be enforced by Tetration itself or exported to generate policies in an existing environment (e.g. Cisco ACI).

Behavior analysis of workloads deployed everywhere

Another benefit of the network telemetry is that you have visibility on any packet, any flow at any time (you can keep up to 2 years of historical data, depending on your Tetration deployment and DC architecture) among two or more application tiers. You can detect performance degradation, ie increasing latency between two application tiers and see the overall status of any complex application.

How to onboard applications in Tetration Analytics
When you start collecting information from the network and the servers into the analytics cluster, you need to give it a context. Every flow needs to be associated to applications, tenants, etc. so that you can give it business significance.
This can be done through the user interface or through the API of the Tetration cluster, matching metadata that come associated with the packet flow. Based on this context, reports and drill down inspection will give you an insight on every breath that the system does.

Automation makes Deployment of Software Applications secure and compliant

The lifecycle of Software Applications generally impacts different organizations in the IT, spreading responsibility and making it hard to ensure quality (including security) and end-to-end visibility.
This is where Cisco Cloud Center comes in. It is a solution for two main use cases:
  • modeling the automated deployment of a software stack (creating a template or blueprint for deployments)
  • brokering cloud services for your applications (different resource pools offered from a single self-service catalog). You can consume IaaS and PaaS services from any private and public cloud, with a portable automation that frees you from lock-in to a specific cloud provider.
Cisco CloudCenter: one solution for all clouds


Integration of Automated Deployment and Network Analytics

It is important to note that both platforms are very open and come with a significant support for integration API. The joint usage means benefitting from the visibility and the automation capabilities of each product:
CloudCenter
  • Application architecture awareness (the blueprint for the deployment is created by the software architect)
  • Operating System visibility (version, patches, modules and monitoring)
  • Automation of all configuration actions, both local (in the server) and external (in the cloud environment)
Tetration Analytics
  • Application Dependency Mapping, driven by the observation of all communication flows
  • Awareness of Network nodes behavior, including defined policies and deviations from the baseline
  • Not just sampling, but storing and processing anytime metadata for any single packet in the Data Center

The table below shows how each engine provides additional value to the other one:
Leveraging the integration between the two solutions allows a feedback loop between applications design and operations, providing compliance, continuous improvement and delivery of quality services to the business.

Consequently, all the following Tetration Analytics use cases are made easier if all the setup is automated by CloudCenter, with the advantage of being cloud agnostic:
Cisco Tetration use cases


Of course one of the most tangible results claimed by this end-to-end visibility and policy enforcement is security.
More detail on the integration between CloudCenter and Tetration Analytics are described in the second part of this post, where we will demonstrate how easy it is to automate the deployment of software sensors along with the application, as well as preparing the analytics cluster to welcome the telemetry data.

Credits

This post is co-authored with a colleague of mine, Riccardo Tortorici.
He is the real geek and he created the excellent lab for the integration that we describe here, I just took notes from his work.

References


June 15, 2017

The best open source solution for microservices networking


Introduction

There a big (justified) hype around containers and microservices.
Indeed, many people speak about the subject but few have implemented a real project.
There is also a lot of excellent resources on the web, so there is no need for my additional contribution.
I just want to offer my few readers another proof that a great solution exists for containers networking, and it works well.
You will find evidences in this post and pointers to resources and tutorials.
I will explain it in very basic terms, as I did for Cisco ACI and SDN, because I’m not talking to network specialists (you know I’m not either) but to software developers and designers. 
Most of the content here is reused from my sessions at Codemotion 2017 in Rome and Amsterdam (you can see the recording on youtube). 

Containers Networking

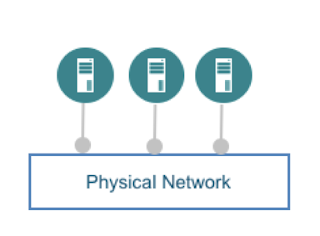
When the world moved from bare metal servers to virtual machines, virtual networks were also created and added great value (plus some need for management).


physical hosts connected to a network
Initially networking was simple

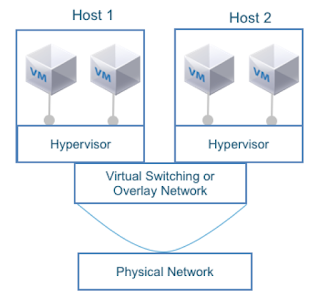
Of course virtual networks make the life of developers and servers managers easier, but they also add complexity for network managers: now there are two distinct networks that need to be managed and integrated.
You cannot simply believe that an overlay network runs on a physical dumb pipe with infinite bandwidth, zero latency and no need for end to end troubleshooting.


Virtual Machines connected to an overlay network

With the advent of containers, their virtual networking layered on top of the VM virtual network (the majority of containers run inside VM for a number of reasons), though there are good examples of container runtime on physical hosts.
So now you have 3 network layers stacked on top of each other, and a need to manage the network end to end that makes your work even more complex.


Containers inside VM: many layers of overlay networks

This increased abstraction creates some issues when you try to leverage the value of resources in the physical environment:
- connectivity: it's difficult to insert network services, like load balancers and firewalls, in the data path of microservices (regardless the virtual or physical nature of the appliances).
- performances: every overlay tier brings its own encapsulation (e.g. vxlan). Encapsulation over encapsulation over encapsulation starts penalizing the performances... just a little  ;-)
- hardware integration: some advanced features of your network (performances optimization, security) cannot be leveraged
Do not despair: we will see that a solution exists for this mess.

Microservices Networking


This short paragraph describes the existing implementation of the networking layer inside the containers runtime.
Generally it is based on a pluggable architecture, so that you can use a plugin that is delegated by the container engine to manage the container's traffic. You can choose among a number of good solutions from the open source community, including the default implementation from Docker.

Minimally the networking layer provides:
- IP Connectivity in Container’s Network Namespace
- IPAM, and Network Device Creation (eth0)
- Route Advertisement or Host NAT for external connectivity


containers networking
The networking for containers

There are two main architectures that allow to plug an external implementation for networking: CNM and CNI. Let's have a look at them.

The Container Network Model (CNM)    


Proposed by Docker to provide networking abstractions/API for container networking. 
It is based on the concept of a Sandbox that contains configuration of a container's network stack (Linux network namespace).
An endpoint is container's interface into a network (a couple of virtual ethernet interfaces).  
A network is collection of arbitrary endpoints that can communicate. 
A container can belong to multiple endpoints (and therefore multiple networks).
  
CNM allows for co-existence of multiple drivers, with a network managed by one driver   
Provides Driver APIs for IPAM and for Endpoint creation/deletion.  
- IPAM Driver APIs: Create/Delete Pool, Allocate/Free IP Address Network   
- Driver APIs: Network Create/Delete, Endpoint Create/Delete/Join/Leave  

Used by docker engine, docker swarm, and docker compose.  
Also works with other schedulers that runs standard containers e.g. Nomad or Mesos.


Container Network Model

Container Network Model


The Container Network Interface (CNI)


Proposed by CoreOS as part of appc specification, used also by Kubernetes. 
Common interface between container run time and network plugin.
Gives driver freedom to manipulate network namespace.
Network described by JSON configuration.

Plugins support two commands: 
- Add Container to Network 
- Remove Container from Network     

Container Network Interface

Container Network Interface

Many good implementations of the models above are available on the web.
You can pick one to complement the default implementation with a more sophisticated solution and benefit from better features.  

It looks so easy on my laptop. Why is it complex?


When a developer sets up the environment on its laptop, everything is simple.
You test your code and the infrastructure just works (you can also enjoy managing... the infrastructure as code).
No issues with performances, security, bandwidth, logs, conflicts on resources (ip address, vlan, names…).
But when you move to an integration test environment, or to a production environment, it’s no longer that easy.
IT administrators and the operations team are well aware of the need for stability, security, multi tenancy and other enterprise grade features.
So not all solutions are equal, especially for networking. Let's discuss their impact on Sally and Mike:


Sally (software developer) - she expects:
Develop and test fast 
Agility and Elasticity 
Does not care about other users


Mike (IT Manager) - he cares for: 
Manage infrastructure 
Stability and Security 
Isolation and Compliance 

These conflicting goals and priorities challenge the collaboration and the possibility to easily adopt a DevOps approach.
A possible solution is a Policy-based Container Networking.
Policy based management is simpler thanks to Declarative Tags (used instead of complex commands syntax), and it is faster because you manage Groups of resources instead of single objects (think of the cattle vs pets example).

What is Contiv


Contiv unifies containers, VMs, and bare metal servers with a single networking fabric, allowing container networks to be addressable from VM and bare-metal network endpoints.  Contiv combines strong network performance, support for industry-leading hardware, and an application-oriented policy that can move across networks together with the application.

Contiv's goal is to manage the "operational intent" of your deployment in a declarative way, as you generally do for the "application intent" of your microservices. This allows for a true infrastructure as code management and easy implementation of DevOps practices.


Contiv provides an IP address per container and eliminates the need for host-based port NAT. It works with different kinds of networks like pure layer 3 networks, overlay networks, and layer 2 networks, and provides the same virtual network view to containers regardless of the underlying technology. 

Contiv works with all major schedulers like Kubernetes, Docker Swarm, Mesos and Nomad. These schedulers provide compute resources to your containers and Contiv provides networking to them. Contiv supports both CNM (Docker networking Architecture) and CNI (CoreOS and Kubernetes networking architecture). 
Contiv has L2, L3 (BGP), Overlay (VXLAN) and ACI modes. It has built in east-west service load balancing. Contiv also provides traffic isolation through control and data traffic. 
It manages global resources: IPAM, VLAN/VXLAN pools.


Contiv Architecture


Contiv is made of a master node and an agent that runs on every host of your server farm:

Contiv and its clustered architecture
Contiv's support for clustered deployments

The master node(s) offer tools to manipulate Contiv objects. It is called Netmaster and implements CRUD (create, read, update, delete) operations using a REST interface. It is expected to be used by infra/ops teams and offers RBAC (role based access control).

The host agent (Netplugin) implements cluster-wide network and policy enforcement. It is stateless: very useful in case of a node failure/restart and upgrade.

A command line utility (that is a client of the master's REST API) is provided: it's named netctl.

Contiv and its cluster wide architecture
Contiv's architecture


Examples


Learning Contiv is very easy: from the Contiv website there is a great tutorial that you can download and run locally.
For your convenience, I executed it on my computer and copied some screenshots here, with my comments to explain it step by step.

First, let's look at normal docker networks (without Contiv) and how you create a new container and connect it to the default network:


Networks in Docker
Networks in Docker


You can inspect the virtual bridge (in the linux server) that is managed by Docker: look at the IPAM section of the configuration and its Subnet, then at the vanilla-c container and its ip address.


How Docker sees its networks


You can also look at the network config from within the container:


the network config from within the container

Now we want to create a new network with Contiv, using its netctl command line interface:

Contiv's netctl command line interface
Contiv's netctl command line interface

Here you can see how Docker lists and uses a Contiv network:


how Docker lists and uses a Contiv network

Look at the IPAM section, the name of the Driver, the name of the network and of the tenant:


We now connect a new container to the contiv-net network as it is seen by Docker: the command is identical when you use a network created by Contiv.


Multi tenancy

You can create a new Tenant using the netctl tenant create command:

Creating tenants in Contiv

A Tenant will have its own networks, that can overlap other tenants' network names and even their subnets: in the example below, the two networks are completely isolated and the default tenant and the blue tenant ignore each other - even though the two networks have the same name and use the same subnet
Everything works as if the other network did not exist (look at the "-t blue" argument in the commands).

Two different networks, with identical name and subnet, can exist in different tenants
Two different networks, with identical name and subnet


Let’s attach a new container to the contiv-net network in the blue tenant (the tenant name is explicitly used in the command, to specify the tenant's network):


All the containers connected to this network will communicate. The network extends all across the cluster and benefits of all the features of the Contiv runtime (see the website for a complete description).


The policy model: working with Groups


Contiv provides a way to apply isolation policies among containers groups (regardless of the tenants, eventually within the tenants).  To do that we create a simple policy called db-policy, then we associate the policy to a group (db-group, that will contain all the containers that need to be treated the same) and add some rules to the policy to define which ports are allowed.

Creating a policy in Contiv


(click on the images to zoom in)

Adding rules to a policy


Finally, we associate the policy with a group (a group is an arbitrary collection of containers, e.g. a tier for a microservice) and then run some containers that belong to db-group:


Creating a group in Contiv, so that many containers get the same policies
Creating a group


The policy named db-policy (defining, in this case, what ports are open and closed) is now applied to all the 3 containers: managing many end points as a single object makes it easy and fast, just think about auto-scaling (especially when integrated with Swarm, Kubernetes, etc.).

The tutorial shows many other interesting features in Contiv, but I don't want to make this post too long  :-)


Features that make Contiv the best solution for microservices networking


  • Support for grouping applications or applications' components.
  • Easy scale-out: instances of containerized applications are grouped together and managed consistently.
  • Policies are specified on a micro-service tier, rather than on individual container workloads.
  • Efficient forwarding between microservice tiers.
  • Contiv allows for a fixed VIP (DNS published) for a micro-service
  • Containers within the micro-services can come and go fast, as resource managers auto-scale them, but policies are already there... waiting for them.
  • Containers' IP addresses are immediately mapped to the service IP for east-west traffic.
  • Contiv eliminates the single point of forwarding (proxy) between micro-service tiers.
  • Application visibility is provided at the services level (across the cluster).
  • Performances are great (see references below).
  • It mirrors the policy model that made Cisco ACI an easy and efficient solution for SDN, regardless the availability of an ACI fabric (Contiv also works with other hw and even with all-virtual networks).

I really invite you to have a look and test it yourself using the tutorial

It's easy and not invasive at all, seeing is believing.